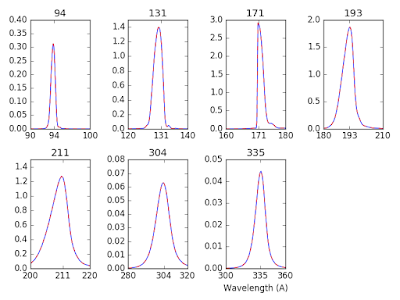
And Then There Were Plots!
These plots are reproduced from Boerner et al. (2012), which utilized initial calibrations of AIA. I have now developed enough of the response module to analyse updated instrumental properties to get my own calibrations using AIA instrument outfiles from SSW.
Filter Calibration
Mirror Calibration
This shows the reflectance of the mirrors per wavelength, and it is exactly like Figure 5 in the paper. Huzzah!
CCD Calibration
Updated: Here the quantum efficiency of the CCD is shown per wavelength, and now it looks like Figure 6 after loading in the UV channels.
Effective Area Functions
Updated: Since re-factoring my code, I now get the shapes expected from the paper. These show the calculated effective area in blue and the effective area loaded in from the .genx file dashed in red.
***


No comments:
Post a Comment